![]()
Interactive map shows Boise River flood threats
Ada City-County Emergency Management
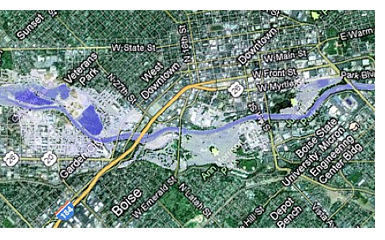
Another great tool has been added to the hazard awareness toolbox. If a picture is worth a thousand words, an interactive one must be even better; and that is exactly what is now available for examining potential flooding issues along the Boise River. A partnership of the U.S. Army Corps of Engineers, the National Weather Service (NWS) and Ada City-County Emergency Management, with special technical assistance from Geographic Information Systems analysts at the City of Boise, produced an interactive map that depicts 15 different flow rates of the Boise River from just below Lucky Peak Dam to the head of Eagle Island.
The map can be found on the Advance Hydrologic Prediction Service section of the NWS website.
A link also can be found on the ACCEM website’s flood preparedness page with many other useful links to flood-related materials at http://www.accem.org/floodprep.html under Boise River Interactive Flood Maps.
Useful tips to maximize the interactive experience
 This interactive, flood inundation map contains large volumes of information. Not all computers or older versions of Internet browsers will be able to display all the different flow ratings. It is recommended to have the most recent versions of your preferred browser and Adobe Flash Player installed on your computer before using this site.
Along the left side of the web page there will be a series of flow ratings listed from highest to lowest in cfs (cubic feet per second). As the cursor passes over each of these flow rates, it should highlight the number and the map will change to depict the highlighted flow. The base map is a Google map, so you can zoom in or out and navigate around as you would other Google maps. The flood water depth can be estimated two ways.
There is a color legend on the right side of the map, or left-click with the mouse on any point of the map within the flood waters should produce a small window with the nearest street address and estimated water depth range for the location chosen.
What the map does and does not reveal
This is the first map of its kind in the western United States. It is based on the most recent computer modeling available to determine where flood waters may go and how deep they may get. Its purpose is for awareness and planning only. The map does not replace or amend the current Digital Flood Insurance Rate Map (DFIRM) that determines what properties fall within the 100-year Floodplain and require flood insurance.
However, the technology used to produce this map is the same technology that will be used to update the DFIRM in the near future. While the results of this map and the future DFIRM may not be identical, this currently available map will allow users to examine the risk to their property based on the most recent information available before there are any potential changes to the DFIRM.
The flow model used provides the best analysis of flooding that it can. It is not the final word on exactly what will happen during a high-water event on the river. Obstructions under bridges or backed-up storm water drains could dramatically affect the way the river reacts, and water could end up in many places not displayed on the map. Properties located anywhere near the flooded areas depicted should prepare for flooding and consider purchasing flood insurance. For more information go to: http://www.floodsmart.gov/floodsmart/
Published 7-6-2012