![]()
ITD adds new tracking feature to innovative dashboard
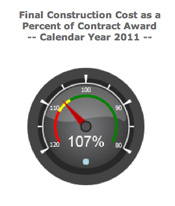
ITD recently introduced a new dashboard tool that tracks the efficiency of construction projects, contrasting the final cost of a project with the initial contract award.
Confining final costs within a 5 percent range (higher or lower) reflects improved efficiency and helps ensure the best use of taxpayer funds. The new dashboard measure supports ITD’s strategic plan goal of using innovative practices, process improvement and technology to reduce costs and operate more efficiently.
 “Stakeholders and the public expect ITD to deliver highway projects that improve safety, enhance mobility and drive economic opportunity,” according to an explanation on the dashboard. “This requires projects to be well designed and delivered within budget – as close to the contract award amount as possible.”
Who benefits from closely aligned contract bids and costs?
ITD has better control of its budget; contractors have better control on bids and costs; and taxpayers benefit through efficient investment of their tax dollars.
Using the new dashboard tracking tool, ITD totals the construction costs after the final payment is made within the calendar year (excluding any additional costs that may have been paid for contractually specified adjustments), totals the bid amounts for those projects at contract award, then compares the adjusted costs to the bid amounts.
ITD attempts to limit increases due to factors within its control, including enhanced risk assessment and management on complex projects, regular process reviews and improvement implementations, ongoing staff training and annual post-construction reviews.
Project costs, as a percentage of bid amounts, improved significantly between 2010 and 2011, falling from 112 percent to 107 percent, narrowly missing the target of 105 percent.
The new dashboard tool is one of nine efficiency measures the department tracks on its Internet site as a way to improve transparency and accountability. The dashboards enable decision-makers and the public to easily follow, in a visual format, ITD’s progress and compare it with neighboring states.
Introduced two years ago, the unique tracking tool received national attention when it was featured in Governing Magazine, a nationwide publication for state and local government leaders.
Other dashboard measures include:
-
Five Year Fatality Rate
-
Percent of Pavement in Good or Fair Condition
-
Percent of Bridges in Good Condition
-
Percent of Highway Projects Developed on Time
-
Construction Cost at Award as a Percent of Budget
-
Administration and Planning Expenditures as a Percent of Total Expenditures
-
Days to Process Vehicle Titles, and
-
DMV Transactions Processed on the Internet
Published 11-2-2012